


ABC analysis offers a practical way to prioritise inventory by grouping products according to their importance. When combined with stock movement data, it can also support better decisions about warehouse organisation and storage space.
What is ABC Analysis in Inventory Management?
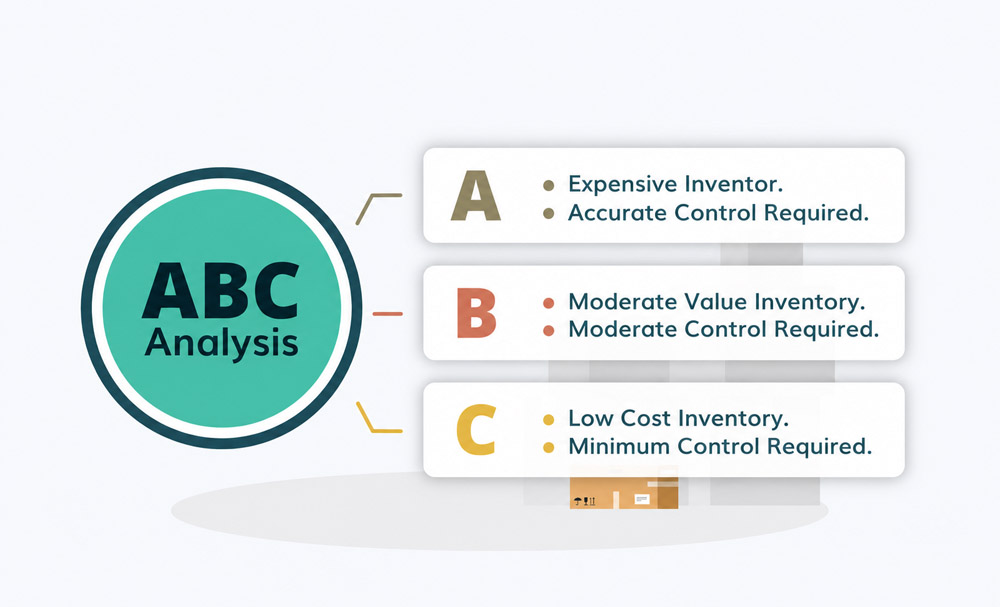
ABC analysis is an inventory classification method that divides products into three categories – A, B and C – based on their relative importance to a business. It helps warehouse managers identify which products require closer attention, making inventory control, stock replenishment and resource allocation more manageable.
- Category A – High-Value Items: Products that contribute the largest share of annual consumption value and generally require closer stock monitoring and control.
- Category B – Moderate-Value Items: Products with a moderate contribution to inventory value that can be managed through regular stock reviews and replenishment planning.
- Category C – Low-Value Items: Products that account for a smaller share of inventory value and may be suitable for simpler stock control procedures.
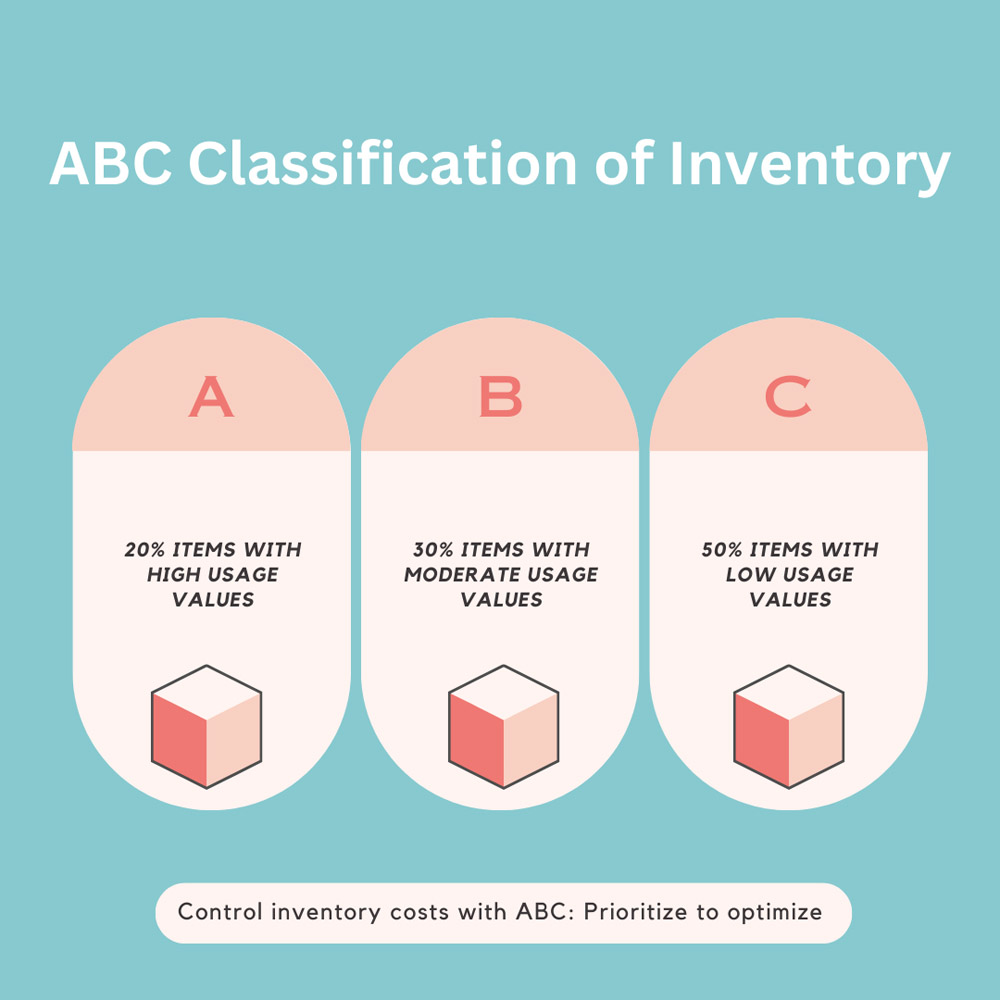
For example, an Australian distribution centre might find that approximately 20% of its SKUs account for 80% of its annual consumption value. While these proportions vary between businesses, ABC analysis provides a clearer picture of where inventory management efforts should be focused.
Read more: Warehouse Racking Layout: Planning a Smarter, Safer Warehouse
ABC Inventory Categories: A, B and C Explained
ABC analysis groups products into three categories based on their contribution to the selected inventory measure. When annual consumption value is used, a common starting point is
| Category | Typical Share of Annual Consumption Value | Management Priority |
| A Items | Around 80% | High |
| B Items | Around 15% | Moderate |
| C Items | Around 5% | Lower |
These percentages are guidelines rather than strict rules. The number of SKUs in each category will depend on how inventory value is distributed across the business.
Category A – High-Value Inventory
Category A includes products that account for the largest proportion of total annual consumption value. Although these items may represent a relatively small share of the product range, they have a significant financial impact.
Category B – Moderate-Value Inventory
Category B covers products with a moderate contribution to total inventory value. These items remain important, but they usually do not require the same level of monitoring as Category A.
Category C – Low-Value Inventory
Category C contains products with the smallest contribution to total annual consumption value. This group often includes a relatively large number of SKUs, even though their combined financial value is limited.
How to Perform ABC Analysis: Formula and Example
ABC analysis does not require complicated software to get started. The process involves collecting data, calculating annual consumption value, ranking products and assigning categories.
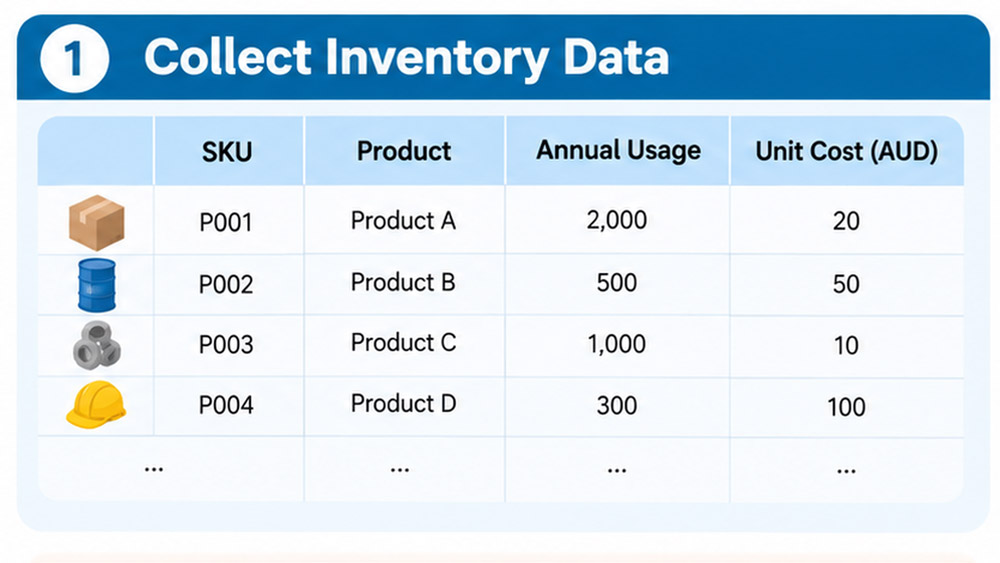
Step 1 – Collect Inventory Data
Start by preparing a list of all SKUs included in the analysis. Each product should have a unique identifier, its annual usage quantity and the relevant unit cost.
For example, a warehouse supplying industrial products might collect the number of units issued or sold over the previous 12 months, together with the purchasing cost of each product.
Using a consistent reporting period is important. Comparing products over different timeframes can produce misleading classifications, particularly when demand changes throughout the year.
Step 2 – Calculate Annual Consumption Value
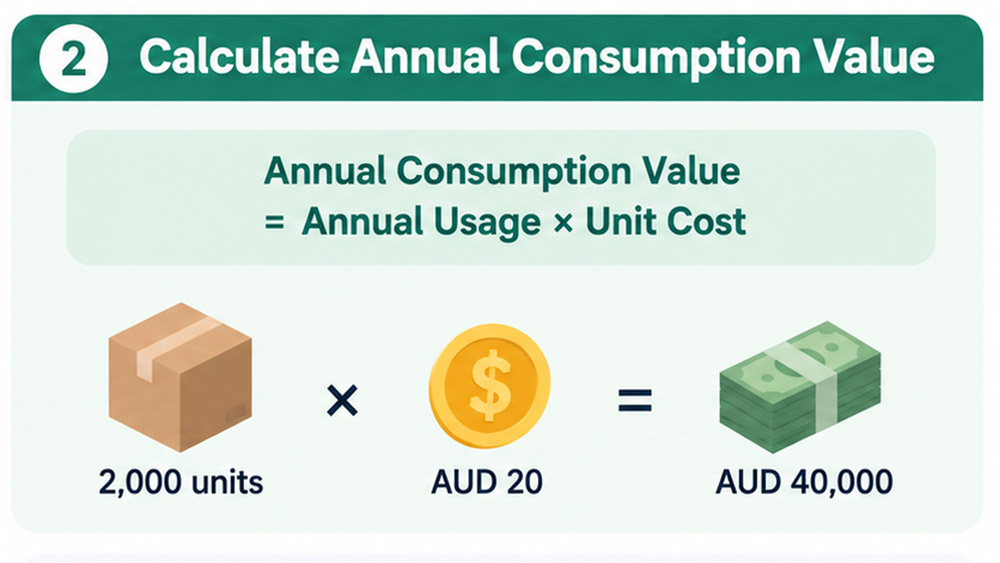
Annual consumption value represents the total cost of a product used or sold over a year. Use the following formula:
Annual Consumption Value = Annual Usage × Unit Cost
For example, if a warehouse uses 2,000 units of a product each year and each unit costs AUD 20:
2,000 × AUD 20 = AUD 40,000
The product has an annual consumption value of AUD 40,000.
Repeat this calculation for every SKU. The resulting figures provide a consistent basis for comparing the financial importance of different products.
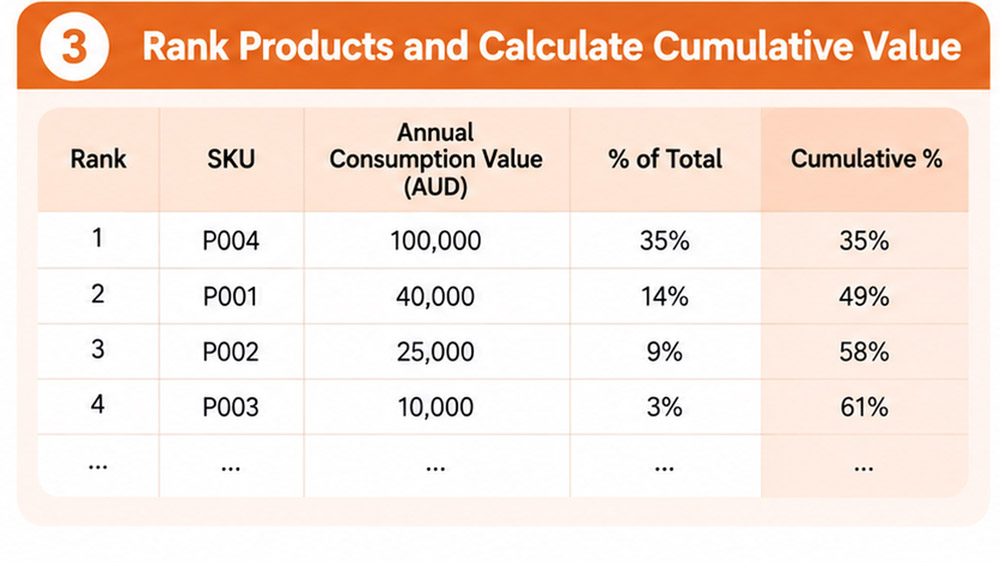
Step 3 – Rank Products and Calculate Cumulative Value
Once the annual consumption values have been calculated, sort the products from highest to lowest.
Next, divide each product’s annual consumption value by the total value of all products to calculate its percentage contribution.
Value Percentage = (Product Annual Consumption Value ÷ Total Annual Consumption Value) × 100
The cumulative percentage is then calculated by adding each product’s percentage to the total of the products ranked above it.
This reveals how quickly the overall inventory value is concentrated among the highest-ranked SKUs.
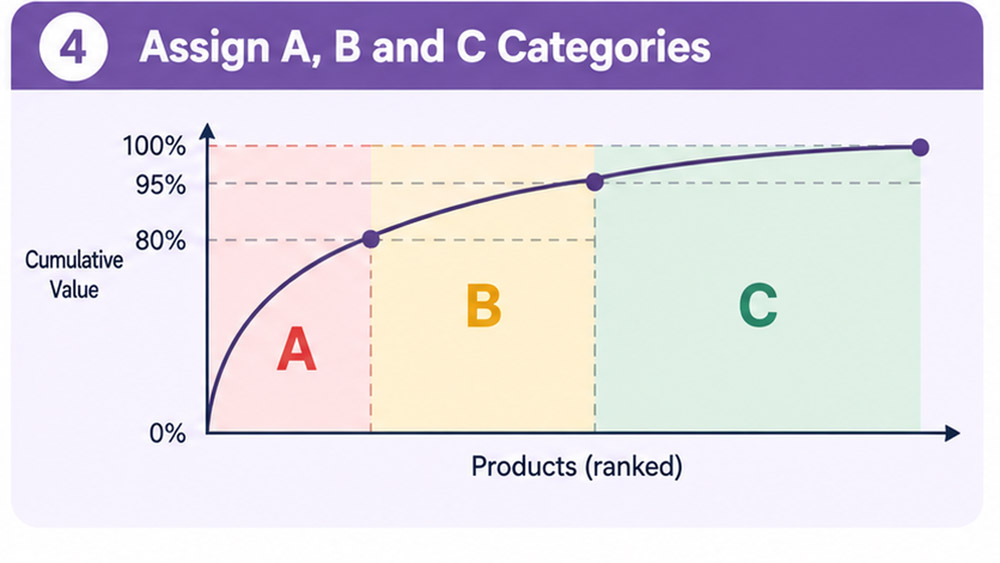
Step 4 – Assign A, B and C Categories
A common approach is to classify products contributing approximately the first 80% of cumulative value as A items, those bringing the total to around 95% as B items, and the remaining products as C items.
There is no requirement for every business to use exactly these thresholds. The categories should reflect the company’s inventory profile and the level of control it needs.
Read more: How often should Pallet Racking be inspected? 3 checks to know
Benefits and Limitations of ABC Analysis
ABC analysis provides a straightforward way to understand inventory priorities, but it works best when businesses recognise both its advantages and its limitations.
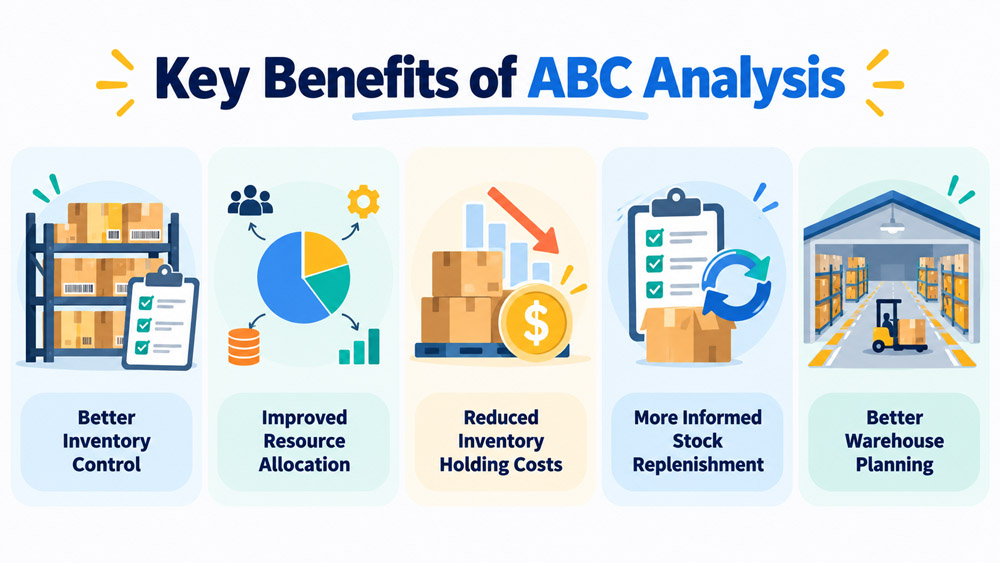
Key Benefits of ABC Analysis
By separating products into different categories, businesses can make more informed decisions about stock control and how resources are allocated.
- Better Inventory Control: ABC analysis highlights products with the greatest financial importance, allowing inventory teams to monitor critical stock levels more closely and identify discrepancies sooner.
- Improved Resource Allocation: Instead of spending equal time reviewing every SKU, warehouse and purchasing teams can direct more attention towards products that have a larger impact on inventory value.
- Reduced Inventory Holding Costs: Understanding which items account for the most inventory expenditure can help businesses review excess stock, purchasing quantities and replenishment decisions.
- More Informed Stock Replenishment: ABC categories provide a useful starting point for setting stock review priorities and identifying products that may require closer supplier coordination.
- Better Warehouse Planning: When combined with stock movement and handling data, inventory classifications can support decisions about storage allocation, accessibility and how warehouse space is used.
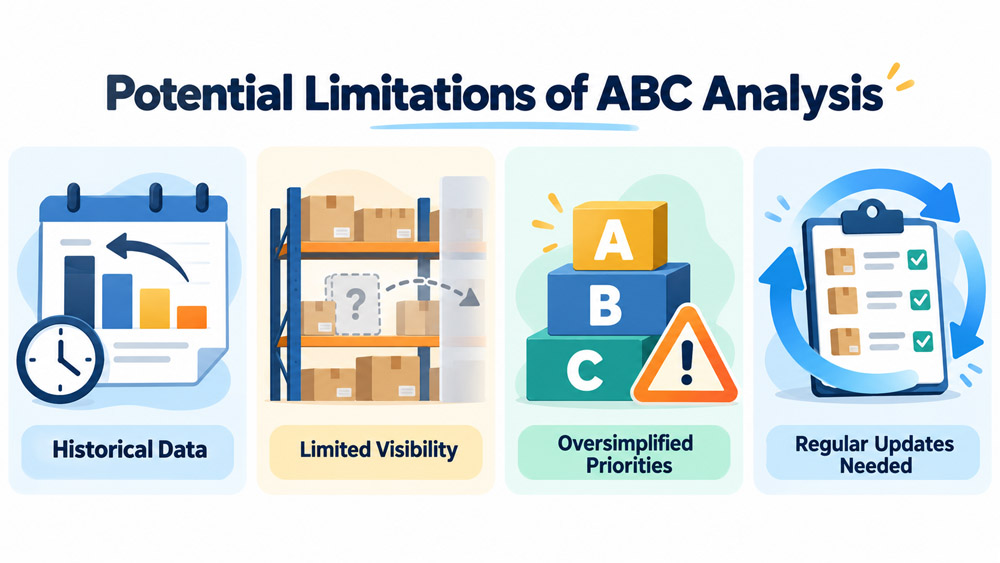
Potential Limitations of ABC Analysis
Although ABC analysis is useful, relying on it alone can overlook important operational factors.
- Dependence on Historical Data: Classifications are usually based on past usage or sales. Seasonal changes, new products or shifting customer demand may make previous results less relevant.
- Limited Visibility of Stock Movement: A value-based ABC analysis does not show how frequently a product is picked or moved within a warehouse. High-value items are not necessarily fast-moving items.
- Oversimplified Inventory Priorities: Products with low annual consumption value can still be essential to operations. A missing low-cost component may delay production or order fulfilment.
- Need for Regular Updates: Inventory profiles change over time. Without periodic reviews, ABC classifications may no longer reflect actual business requirements.
For the best results, ABC analysis should be used alongside inventory turnover, demand patterns, picking frequency and other operational data.
How ABC Analysis Improves Warehouse Layout and Storage Efficiency
ABC analysis can support better warehouse planning, provided it is combined with the right movement and handling information.
Value-Based ABC vs Velocity-Based ABC
One of the most important distinctions in warehouse management is the difference between value-based ABC analysis and velocity-based ABC analysis.
- Value-based ABC ranks products according to their financial contribution, helps businesses determine which inventory requires greater attention from a purchasing and stock control perspective.
- Velocity-based ABC uses movement data instead; products may be ranked by the number of picking visits, order lines or handling movements recorded over a given period.
Consider two products in the same warehouse. One is an expensive industrial component ordered only a few times each month. The other is a low-cost packaging item picked hundreds of times each week.
Warehouse Slotting based on Inventory Movement
Warehouse slotting is the process of assigning products to storage locations based on their handling and operational requirements.
When products are classified by picking frequency, warehouse teams can identify which items should be easier to access. A well-planned slotting strategy considers these factors together, creating a layout that supports daily operations rather than following ABC categories without adjustment.
Balancing Storage Density and Accessibility
Making better use of warehouse space does not always mean fitting in more pallets. The right balance depends on inventory movement, available warehouse space and the equipment used to handle goods.
Combining ABC movement data with storage capacity planning allows warehouse managers to identify where direct accessibility matters most and where higher-density storage may be appropriate.
Warehouse Safety and Material Handling
In Australia, warehouse operators should follow applicable Work Health and Safety (WHS) requirements and relevant standards for pallet racking. WorkSafe Victoria’s guidance on pallet racking highlights the importance of safe working loads, appropriate handling equipment, clearances and regular inspections.
ABC analysis can guide where inventory should be located, but storage decisions must still account for rack load capacities, forklift specifications and safe access throughout the facility.
Best Practices for Applying ABC Analysis in Australian Warehouses
ABC analysis delivers the most value when it becomes part of regular inventory management rather than a one-off exercise.
As product ranges, customer demand and warehouse operations change, businesses need to review their classifications and adjust their approach.
A few practical habits can make ABC analysis more useful:
- Review classifications regularly: Reassess ABC categories as inventory value, sales patterns and product demand change. Quarterly reviews may suit some businesses, while others may need more frequent updates.
- Consider seasonal demand: Products that sell slowly for most of the year may become important during seasonal peaks. Historical averages should be reviewed alongside expected demand changes.
- Combine ABC with stock movement data: Use picking frequency, order lines and inventory turnover to understand how products move through the warehouse, rather than relying on financial value alone.
- Use inventory management software: A Warehouse Management System (WMS) or inventory platform can make it easier to track SKUs, review stock movements and maintain accurate classifications.
- Monitor demand variability: For businesses with unpredictable demand, combining ABC with XYZ analysis can provide additional insight. XYZ classification groups products according to how stable or variable their demand is.
- Review warehouse storage arrangements: As inventory profiles change, reassess product locations, pallet capacity and accessibility to determine whether the current layout still meets operational needs.
ABC analysis is a useful starting point for understanding inventory priorities. Its value grows when businesses use those findings to improve purchasing decisions, stock control and the organisation of their warehouse.
If your current warehouse layout no longer suits your inventory requirements, Vinatech Australia’s warehouse design services can help you explore storage configurations based on your available space, pallet requirements and daily operations.
Vinatech Australia: Industrial Warehouse Racking – Warehouse Shelving Solutions
🌐 Website: https://vinatech.com.au/
☎️ Phone number: 0485 083 868
📩 Email: info@vinatech.com.au
📌 Address: 34 Paramount Bvd, Cranbourne West VIC 3977, Australia

William Harris is the Production Director at Vinatech Australia, with more than 10 years of experience in industrial warehouse racking, manufacturing, warehouse optimisation and smart storage technologies. His professional background combines engineering, production management and warehouse operations, enabling him to oversee the development of storage systems designed for safety, durability, efficiency and long-term operational performance.